
SaaS Metrics Calculator: How to Read LTV, CAC and Churn
The free SaaS metrics calculator turns MRR, customers, churn, gross margin and CAC into LTV:CAC, CAC payback, GRR, NRR and a 24-month MRR projection. Here are its formulas, a worked example, and how to read each result against published benchmarks.

The free SaaS metrics calculator turns the numbers you already track (monthly recurring revenue, active customers, churn, gross margin and customer acquisition cost) into the unit economics investors ask about. It shows LTV:CAC and CAC payback with a healthy, watch or risk badge, gross-margin LTV, annual churn, gross and net revenue retention, and a 24-month MRR projection. It takes about a minute. The harder part is knowing which of those outputs to trust, and what they leave out.
This guide covers the exact formulas the calculator uses, a worked example with realistic numbers, how to read the results against published benchmarks, and the mistakes that make a healthy-looking ratio lie to you.
What the calculator computes
The inputs are MRR, active customers, monthly customer churn, gross margin, CAC, new customers per month, monthly expansion MRR and your segment. CAC can be typed directly, or derived from monthly sales and marketing spend. Here is the math, exactly as the tool runs it:
| Output | Formula in the calculator |
|---|---|
| ARR (annual recurring revenue) | MRR × 12 |
| ARPA (average revenue per account) | MRR ÷ active customers |
| Customer lifetime | 1 ÷ monthly churn, in months |
| Annual churn | 1 − (1 − monthly churn)^12, compounded rather than × 12 |
| Revenue LTV | ARPA ÷ monthly churn |
| LTV (gross margin) | ARPA × gross margin ÷ monthly churn |
| CAC | As entered, or monthly sales and marketing spend ÷ new customers per month when both are filled in |
| LTV:CAC | Gross-margin LTV ÷ CAC |
| CAC payback | CAC ÷ (ARPA × gross margin), in months |
| Gross revenue retention (GRR) | (1 − monthly churn)^12 |
| Net revenue retention (NRR) | (1 − monthly churn + monthly expansion)^12 |
| 24-month projection | Each month keeps (1 − churn + expansion) of last month's MRR and adds new customers × ARPA |
| Steady-state MRR | New customers × ARPA ÷ (churn − expansion), shown only when churn exceeds expansion |
The headline LTV is on a gross-margin basis, with the revenue figure shown beside it for comparison. The segment picker sets the payback target: 12 months for SMB, 18 for mid-market and 24 for enterprise. If an input a metric needs is missing, such as zero churn or a blank customer count, that card shows n/a instead of a number.
Why these numbers matter
A subscription business spends money up front to win a customer and earns it back slowly. Every metric in this calculator is a way of asking whether that trade is worth making, and how fast.
David Skok's widely cited guide, SaaS Metrics: A Guide to Measuring and Improving What Matters, offers two rules of thumb. LTV should be at least 3x CAC, and a startup should recover its CAC in less than 12 months. He also shows that average customer lifetime is 1 ÷ churn rate. That single line is why churn dominates the LTV result.
My view, from building LoginRadius as a B2B SaaS company, is that founders rarely get these numbers wrong through bad arithmetic. They get them wrong through bad inputs. The calculator does the division. You are responsible for what goes in.
How to use it: a worked example
Take a hypothetical B2B SaaS company. These are sample numbers, not real company data. They are also the calculator's default example, so the page opens with them already filled in:
- Monthly recurring revenue: $48,000
- Active customers: 120
- Monthly churn: 2% of customers
- Gross margin: 78% (an assumption for this example, not a benchmark)
- Customer acquisition cost: $6,000 per new customer
- New customers per month: 5, with no expansion revenue
- Open the calculator and enter $48,000 as monthly recurring revenue. Use recurring subscription revenue only.
- Enter 120 as active customers. Count paying accounts, not users or seats.
- Enter 2 as monthly customer churn and 78 as gross margin.
- Enter 6,000 as CAC. If you would rather derive it, leave CAC alone and fill in monthly sales and marketing spend plus new customers per month.
- Pick your segment. SMB sets a 12-month payback target.
- Read the result cards as you type. There is no submit button.
- Click Copy summary & link to copy the key numbers plus a link that reopens this exact scenario. Your inputs live in the page address, so a bookmark works too.
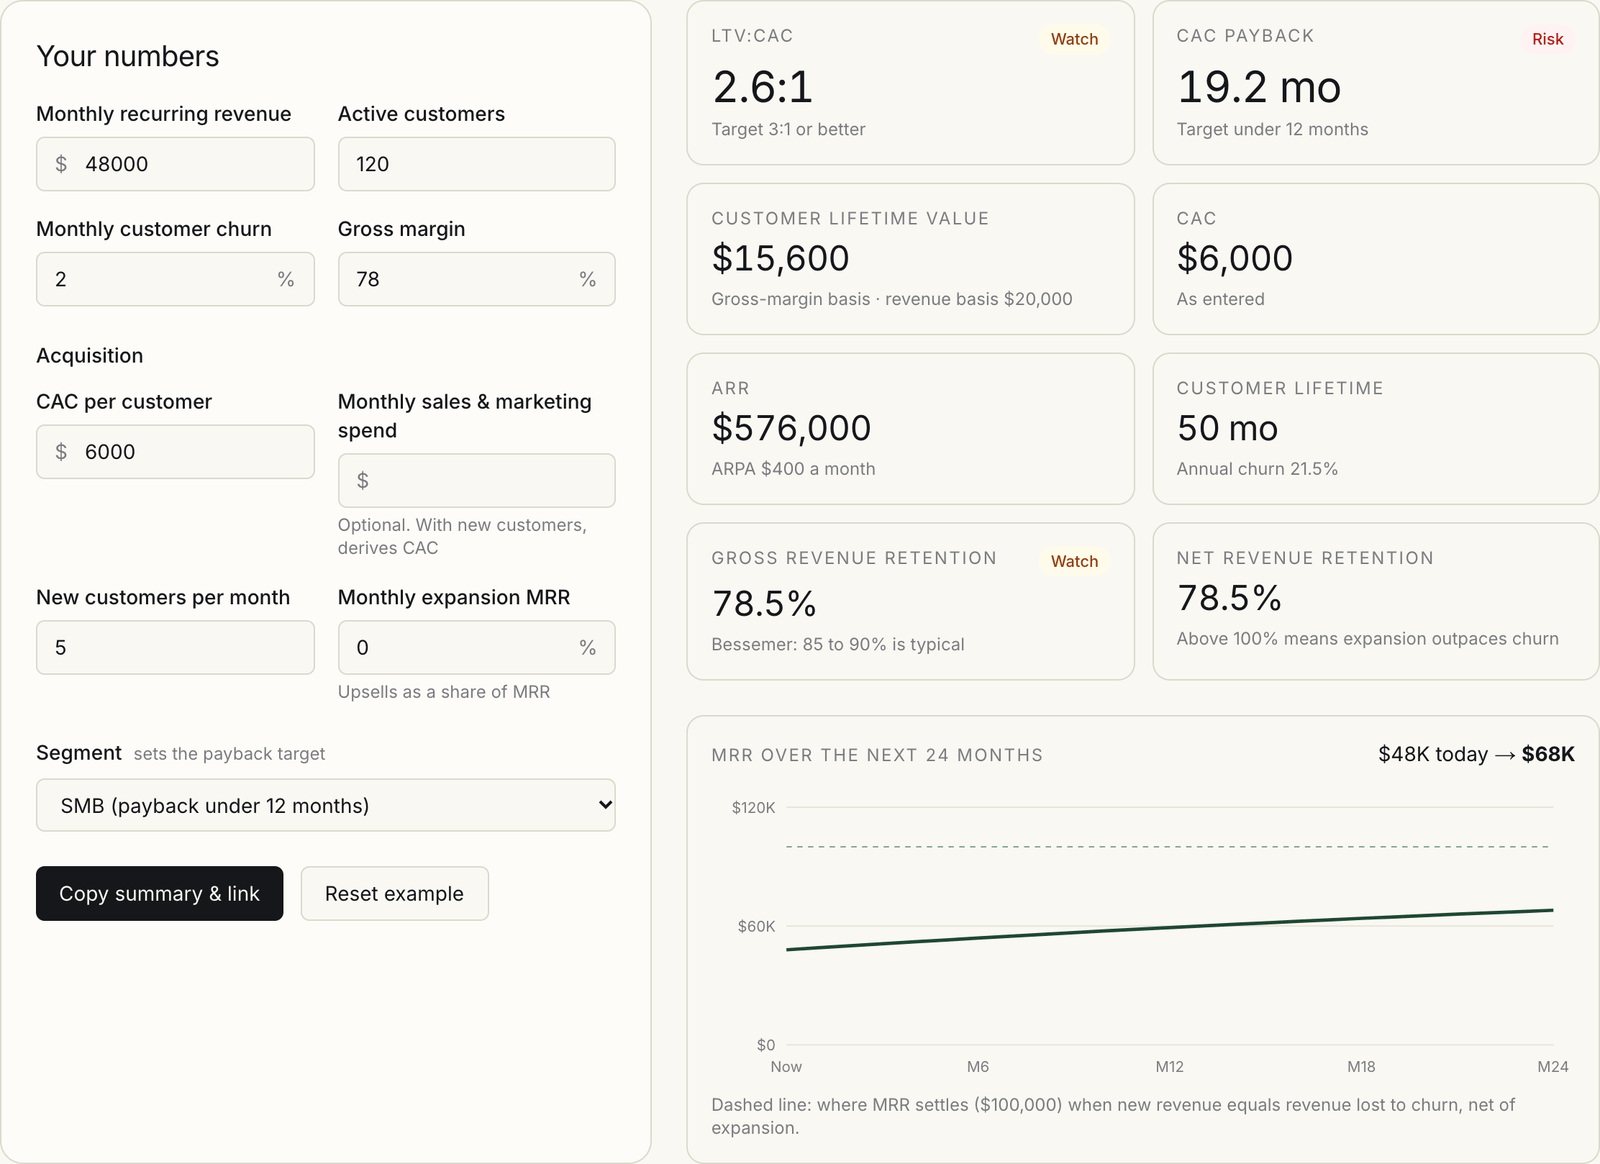
The results check out by hand. ARR is $48,000 × 12 = $576,000. ARPA is $48,000 ÷ 120 = $400. Revenue LTV is $400 ÷ 0.02 = $20,000. On a 78% gross margin, LTV is $20,000 × 0.78 = $15,600. LTV:CAC is $15,600 ÷ $6,000 = 2.6:1.
On revenue alone, this company would clear Skok's 3x bar at 3.3:1. On margin, it falls short, so the badge reads watch. Now change one input. Set churn to 4%.
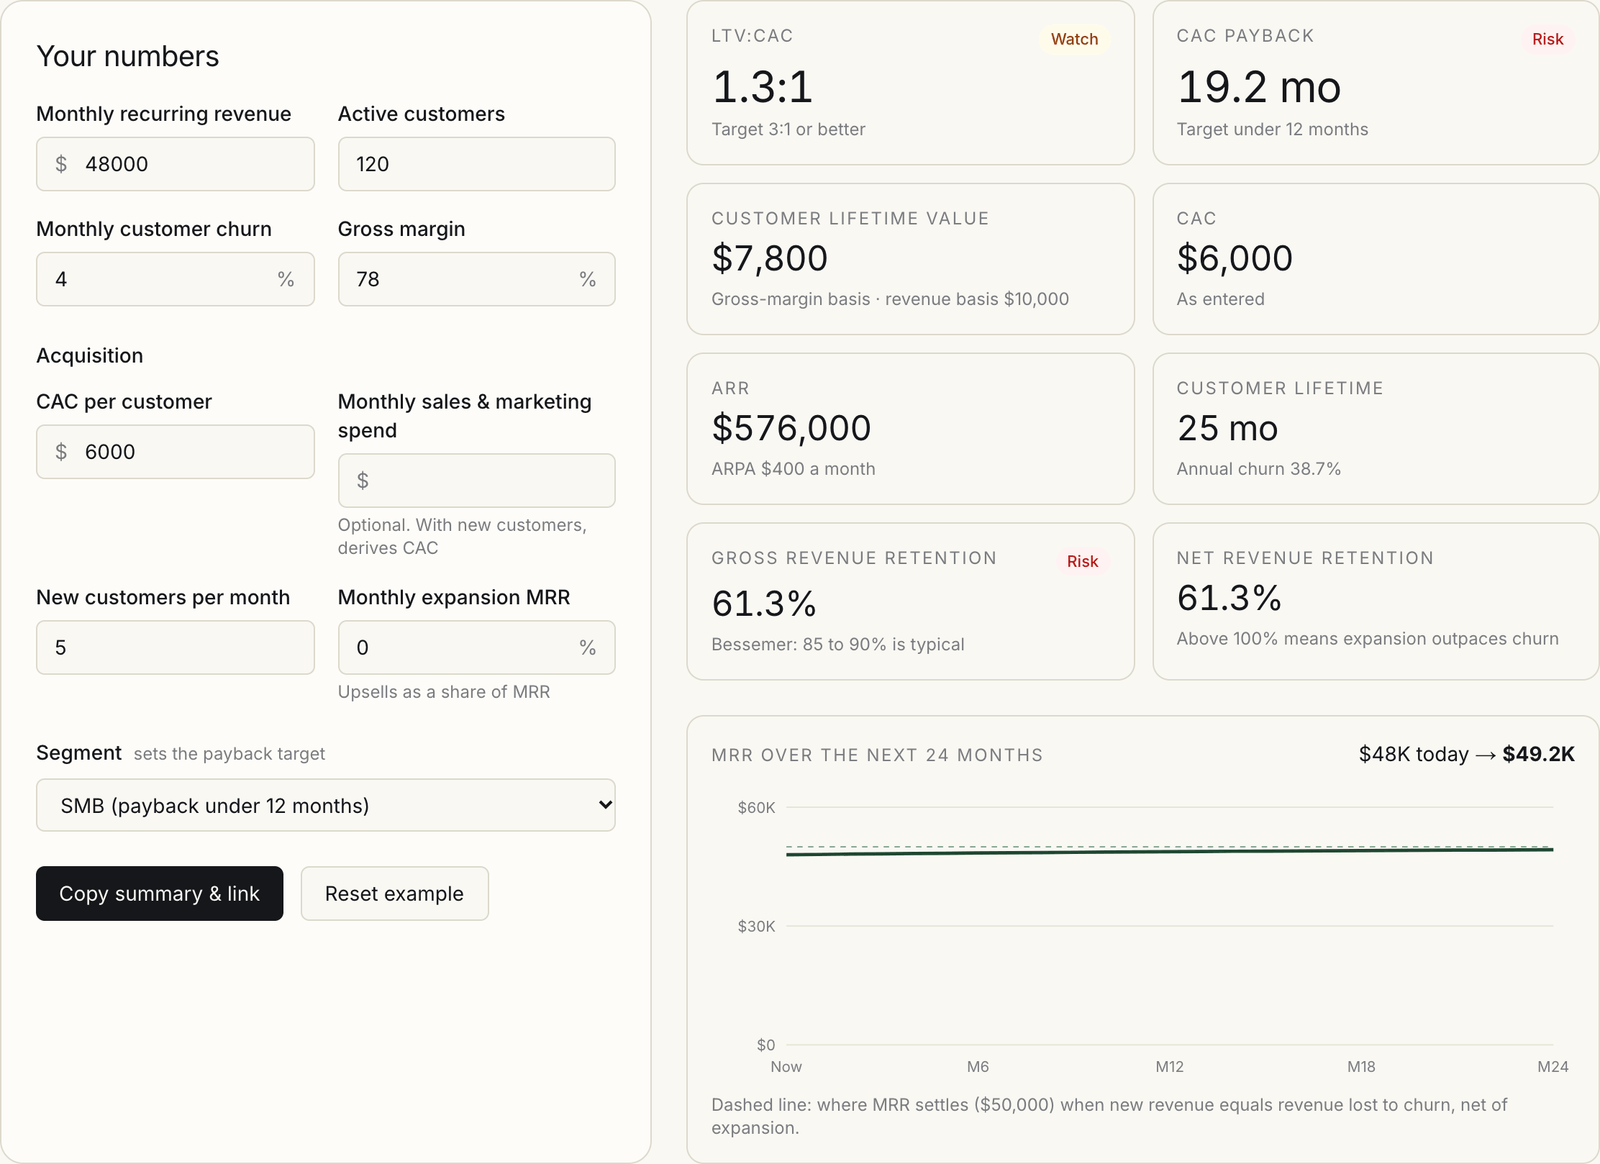
LTV halves to $7,800 (revenue basis $10,000) and the ratio falls to 1.3:1. Annual churn jumps from 21.5% to 38.7%. Nothing about sales or pricing changed. This is the most useful thing the calculator does: it makes the churn sensitivity impossible to ignore. Skok puts it directly: halve your churn rate and you double your LTV.
Notice what did not move. CAC payback stays at 19.2 months, because payback depends on CAC, ARPA and margin, not on churn. That is exactly why you need both numbers.
Reading the results
ARR and ARPA
These are only as good as the revenue you put in. The calculator treats whatever you enter as recurring. ARR here is a simple run rate, MRR × 12. It is not a forecast. The projection chart covers the forecast.
ARPA is an average across every account. If you sell a $99 self-serve plan and a $2,000 enterprise plan, a $400 ARPA describes nobody. Run the calculator once per segment instead of once for the company. If your pricing is moving away from seats, my piece on why AI is killing the SaaS seat explains why per-account revenue is becoming the more honest unit.
LTV and LTV:CAC
Skok defines LTV as ARPA × average customer lifetime minus the cost to serve the customer. The calculator gets close to that by multiplying revenue LTV by your gross margin, and it compares that figure to CAC. It marks 3:1 or better as healthy, 1:1 to 3:1 as watch, and below 1:1 as risk.
The revenue LTV stays on the card for comparison. In the worked example the gap between the two is the gap between passing and failing the 3x test.
CAC payback
Payback is the number of months of margin it takes to earn back CAC: CAC ÷ (ARPA × gross margin). For the sample company that is $6,000 ÷ ($400 × 0.78) = 19.2 months. Bessemer Venture Partners measures payback on gross margin-adjusted revenue in Scaling to $100 Million. It suggests targets under 12 months for SMB-focused companies, under 18 for mid-market and under 24 for enterprise. The same report puts average payback for companies between $1 million and $10 million ARR at 15 months.
Those targets drive the badge. A payback within your segment's target is healthy, up to one and a half times the target is watch, and anything longer is risk. The watch and risk bands are my rules of thumb, not published thresholds.
A $400 monthly ARPA usually means SMB or low mid-market buyers. At 19.2 months, this company misses the SMB target by enough to show risk, and sits just past the mid-market one. That is why I read payback before the ratio. A ratio tells you the trade is profitable eventually. Payback tells you how much cash you need to survive until it is.
Churn, GRR and NRR
The calculator asks for customer churn, the share of accounts that leave each month. It compounds that into annual churn. At 2% a month you lose 2% of a shrinking base, which is about 21.5% a year, not 24%.
Investors often look at revenue retention instead. Gross revenue retention is the share of revenue you keep from existing customers over a year, ignoring upsells. Bessemer reports gross retention as "relatively consistent at 85-90%" across ARR ranges, and the calculator marks 85% or more as healthy. The sample company's 78.5% shows watch, and at 4% churn it drops to 61.3%, which shows risk.
Net revenue retention adds expansion back in. With no expansion, NRR equals GRR. Above 100% means expansion outpaces churn, so the existing base grows on its own. Both figures assume churned accounts carry average revenue. Losing many small accounts and few large ones produces very different numbers on each measure, so treat these as estimates.
The 24-month MRR projection
The chart runs your inputs forward month by month. Each month keeps (1 − churn + expansion) of the previous month's MRR and adds new customers × ARPA. With 5 new customers a month and no expansion, the sample company grows from $48,000 to about $68,000 in 24 months.
The dashed line is steady state: the MRR at which new revenue exactly replaces what churn takes away. The formula is new customers × ARPA ÷ (churn − expansion). For the sample company that is 5 × $400 ÷ 0.02 = $100,000. However hard sales works at that pace, MRR flattens toward that ceiling.
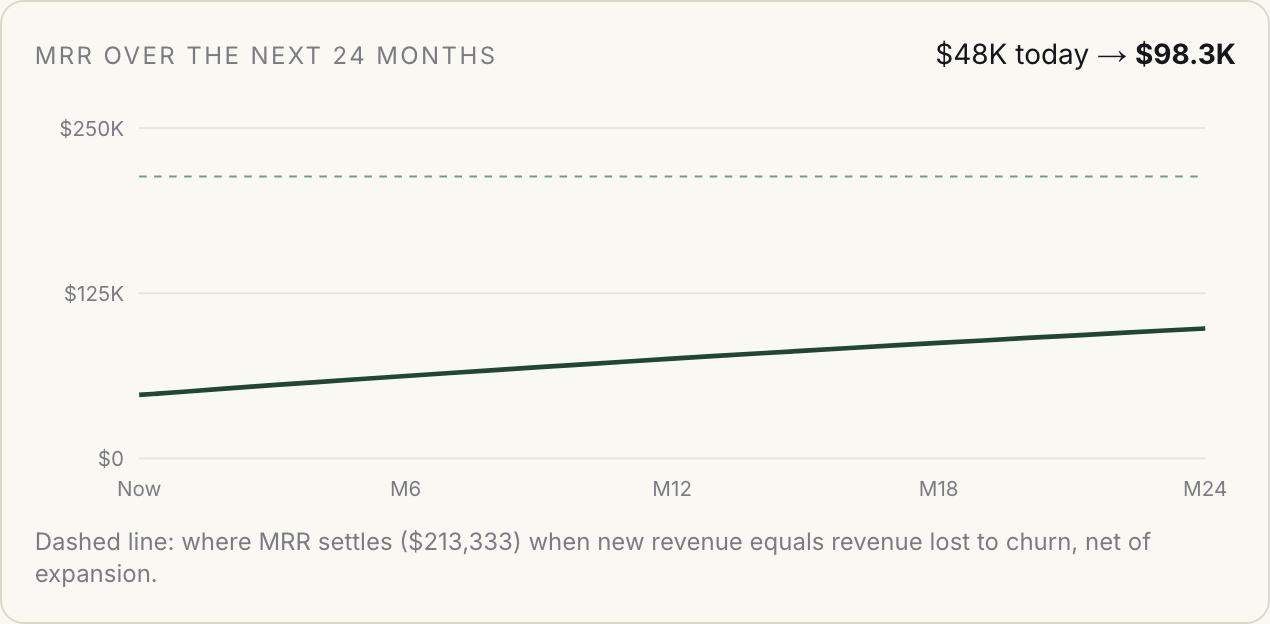
Raise new customers to 8 and add 0.5% monthly expansion, and the ceiling moves to 8 × $400 ÷ 0.015 = $213,333. Expansion works on the denominator, which is why a small upsell rate moves the ceiling so far. If expansion matches or beats churn, there is no ceiling, and the chart says MRR keeps compounding instead.
Common mistakes founders make with these metrics
1. Putting non-recurring revenue into MRR
Setup fees, implementation projects and one-off services are real revenue, but they do not recur. Put them in and ARR, ARPA and LTV all inflate together. Enter subscription revenue only.
2. Guessing gross margin
Hosting, support and third-party costs come out of every dollar of subscription revenue. In identity, where infrastructure and uptime obligations are heavy, I treat gross margin as a first-class input rather than a footnote. The calculator now applies it to both LTV and payback, so an optimistic margin flatters both at once.
3. Understating CAC
The most flattering CAC counts only ad spend. An honest one includes sales and marketing salaries, tools and commissions. Bessemer's definition also includes customer success costs tied to renewal, upsell or cross-sell. If you use the spend field to derive CAC, enter the fully loaded monthly figure. If channel choice drives your CAC, my ranking of growth channels by GTM focus covers why referral and inbound tend to cost least.
4. Trusting a lifetime longer than your history
At 2% monthly churn, 1 ÷ churn implies a 50-month average lifetime. If your company is 18 months old, you have not observed a 50-month customer yet. The formula extrapolates. Keep the LTV, but discount it in your head until cohorts confirm it.
5. Measuring churn against the wrong base
On annual contracts, most customers cannot churn in a given month. Dividing monthly cancellations by your whole base understates churn. Skok recommends tracking churn only among customers who are at the point where they have the option to leave.
6. Averaging across segments
One blended number hides a strong segment and a losing one. Run the calculator separately for each plan or customer type, and set the segment picker to match. The segment with the worst payback usually deserves the hardest look.
What the calculator cannot tell you
It is a model built on averages. It does not read cohorts, so it cannot tell you whether churn is improving or getting worse. The projection assumes your churn, expansion and new-customer pace hold steady for two years, which they rarely do. Retention assumes every churned account carries average revenue. Use it to sanity-check unit economics and to see how sensitive they are, then build the fuller model in a spreadsheet with your own cohort data.
If you are early enough that cash runway matters more than ratios, the startup offers directory lists credit programs that lower costs while payback is still long.
FAQ
What is a good LTV:CAC ratio for SaaS?
David Skok's rule of thumb is at least 3:1. Bessemer's Scaling to $100 Million recommends investing in customer acquisition when CLTV to CAC is 3x or more, and notes customers only become profitable after 1x. The calculator marks 3:1 or better as healthy, 1:1 to 3:1 as watch, and below 1:1 as risk. It uses gross-margin LTV, so its ratio is stricter than one built on revenue.
How does the calculator compute customer lifetime value?
It multiplies ARPA by gross margin and divides by monthly churn as a decimal. At $400 ARPA, 78% margin and 2% churn, LTV is $400 × 0.78 ÷ 0.02 = $15,600. The revenue LTV, $20,000 here, is shown alongside for comparison.
Does the calculator show CAC payback?
Yes. It computes CAC ÷ (ARPA × gross margin) in months and badges the result against your segment's target. Bessemer suggests under 12 months for SMB, under 18 for mid-market and under 24 for enterprise.
Should I use customer churn or revenue churn?
The calculator expects customer churn, the share of accounts leaving each month. It then estimates gross and net revenue retention from it, assuming churned accounts carry average revenue. Revenue churn is better for judging retention when account sizes vary widely. Track both, and do not compare one against a benchmark for the other.
Is my data sent anywhere?
No. The calculator runs in your browser and computes the numbers with JavaScript on the page. Your inputs only appear in the page address, so you can bookmark or share a scenario. There is nothing to sign up for. You can find it and other free tools on the free tools page, or go straight to the SaaS metrics calculator.
More like this
All Founders & Growth- Founders & GrowthThe Hard Truths About SaaS in 2026Building software just got 10x easier with AI. That breaks most of the 2015 SaaS playbook. Here are the new hard truths every SaaS…
- Founders & GrowthThe Fundraising Sequence from Pre-Seed to Series AMost founders treat fundraising as a personality test. It is a process with a start date, a list, and a close. Here is the sequence, and…
- Founders & GrowthI Mapped Every Major Startup Credit Program for 2026. Most Founders Are Leaving $500K+ on the TableFounders raise venture money to extend runway. Then they leave six figures of free credits sitting in a portal they never logged into.
Get new Founders & Growth writing
Enjoyed this? Subscribe and tell us what you read most. Founders & Growth is already ticked for you. No tracking pixels, unsubscribe with one click.